Well geopolitics have moved to the forefront and this has made it difficult from the long side, for at least a day. What do I say about this: Forgetaboutit! That's probably my New Jersey roots shining through. But don't pay attention to the headlines. It's the headlines that are going to scare you out of a good position and I'm not having it. The only thing you should be paying attention to is your individual stocks and how they are trading.
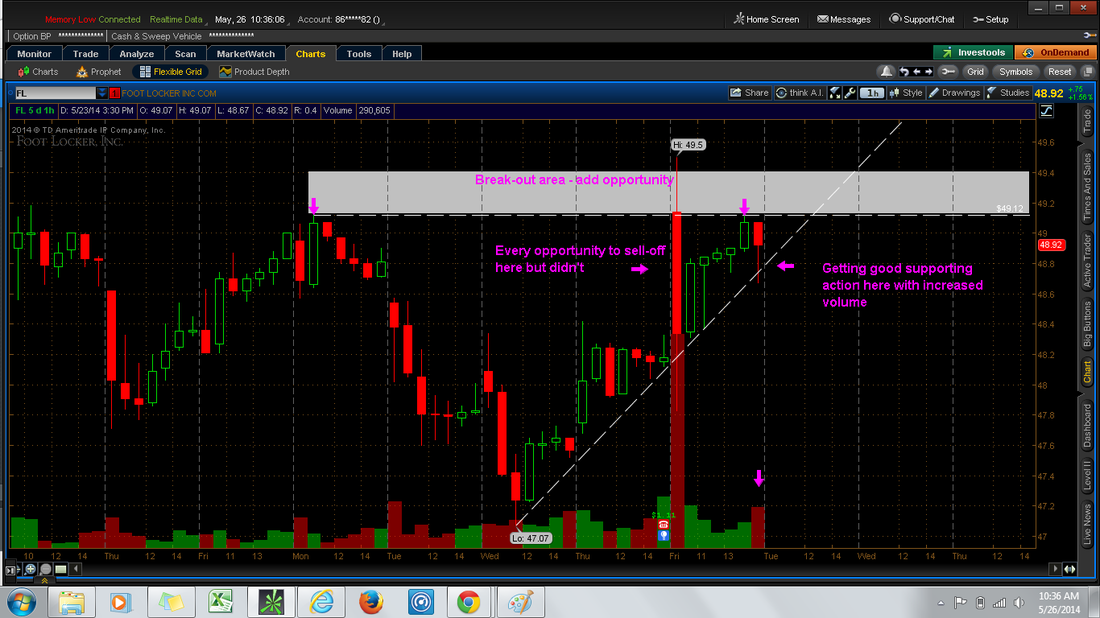
Case in point let me bring up the TBT trade that I put on last week. So far its been a bust! And today especially didn't help matters. Below you're going to see a 5 minute 1 day chart of the TBT and you will see what you want to avoid getting caught up in.
Case in point let me bring up the TBT trade that I put on last week. So far its been a bust! And today especially didn't help matters. Below you're going to see a 5 minute 1 day chart of the TBT and you will see what you want to avoid getting caught up in.
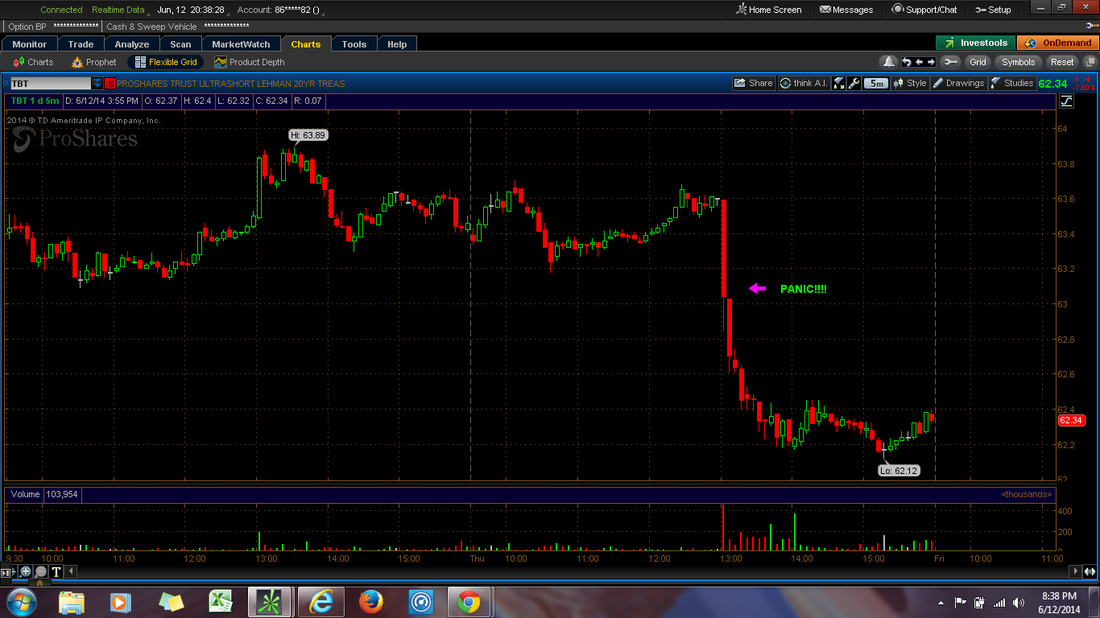
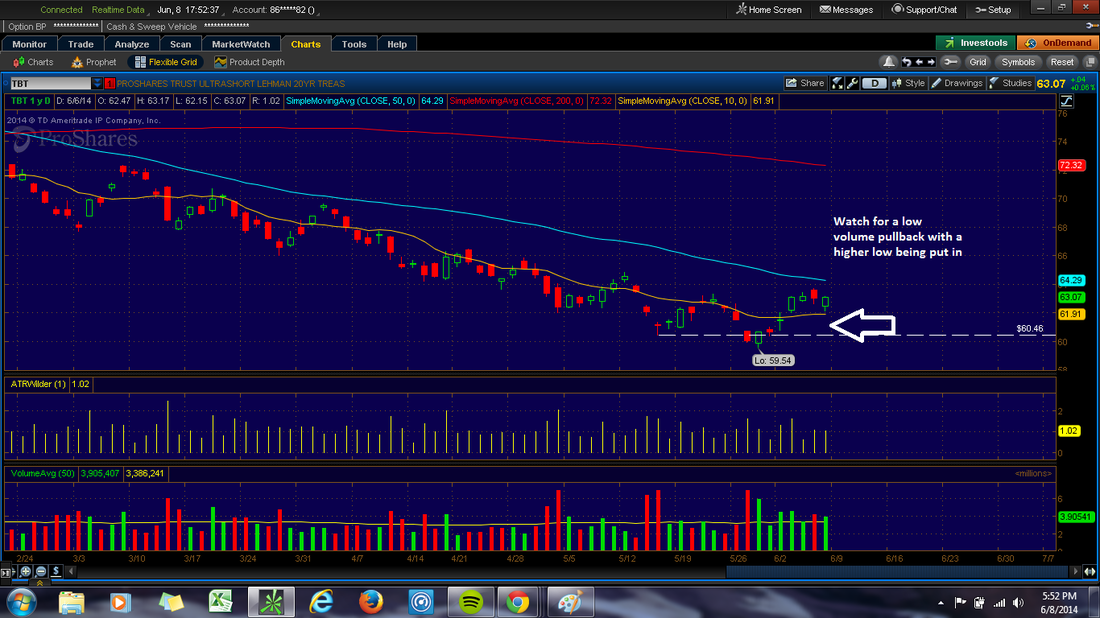
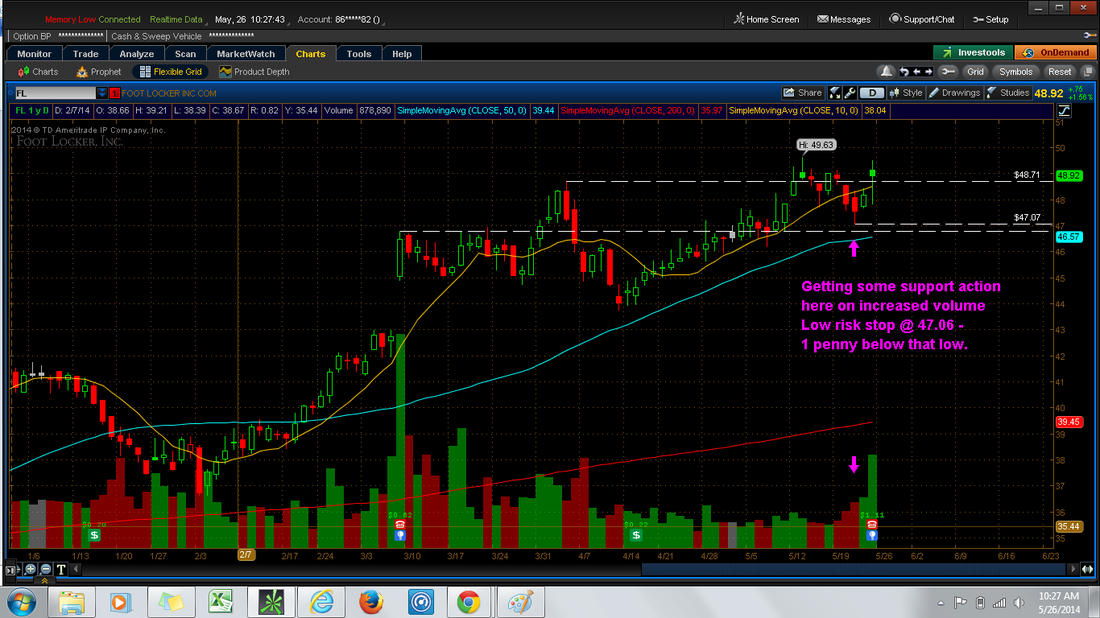
PANIC!!!! You don't want to get mixed up in it because it's going to cause you to make a hasty decision. What you want to do in times like this is get a bigger picture of the market, TBT in this case, and figure out how you're going to manage this trade on the fly. Below you'll see a picture of TBT on a 20 day, 30 minute time frame. It gives me a much clearer view of what is happening.
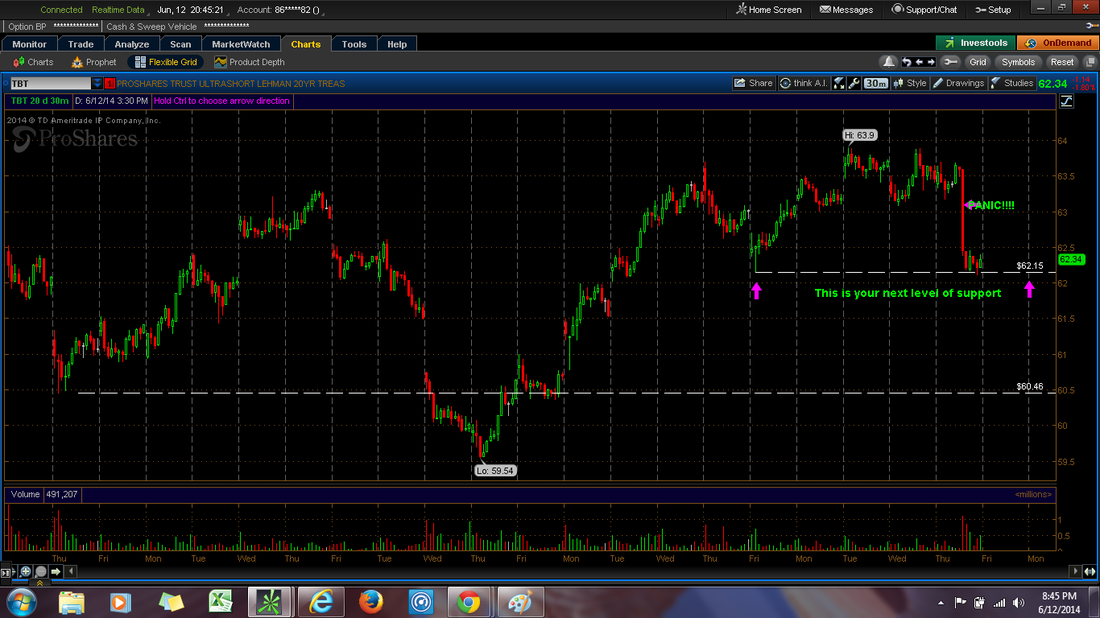
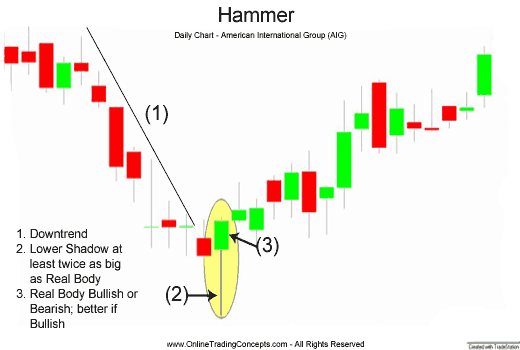
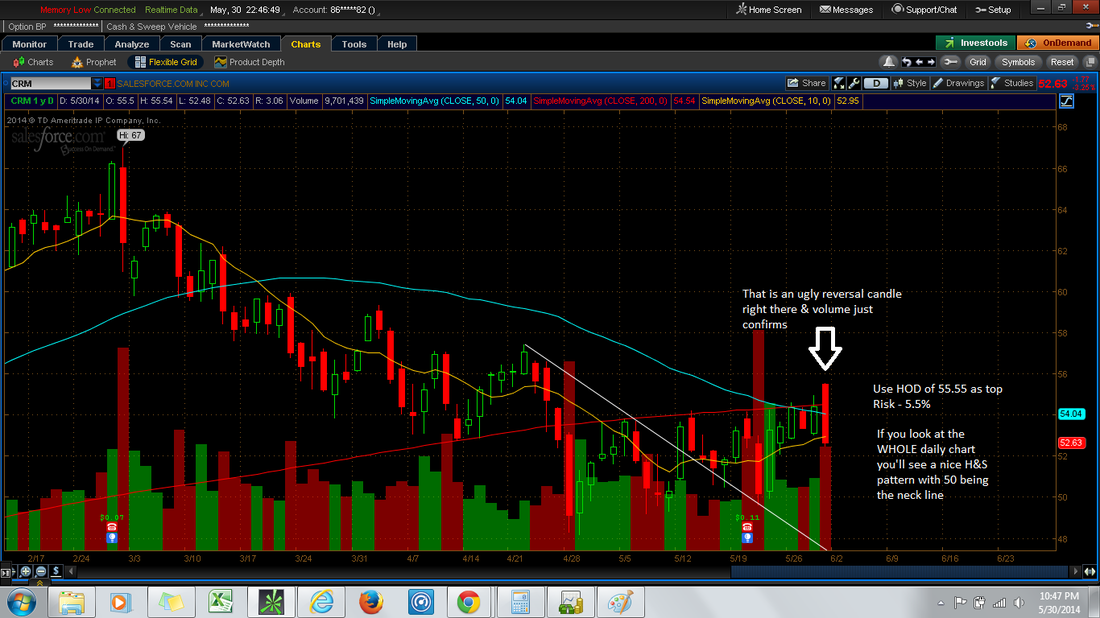
Since the stock had already broken down through some support I had to find the next level where the stock might come to a rest. Lo and behold if we go back to trading last Friday you'll see a nice supporting bar with volume. What I mean by supporting bar is that the stock was at first overrun by sellers but buyers came and supported the stock, and push it back up to the high of that time frame, in this case, 30 minutes. What makes this bar especially bullish is the volume the supports it. The higher the volume the more support it is getting from the buyers. Below is an example of a supporting bar or what they call a "hammer" in the trading world.
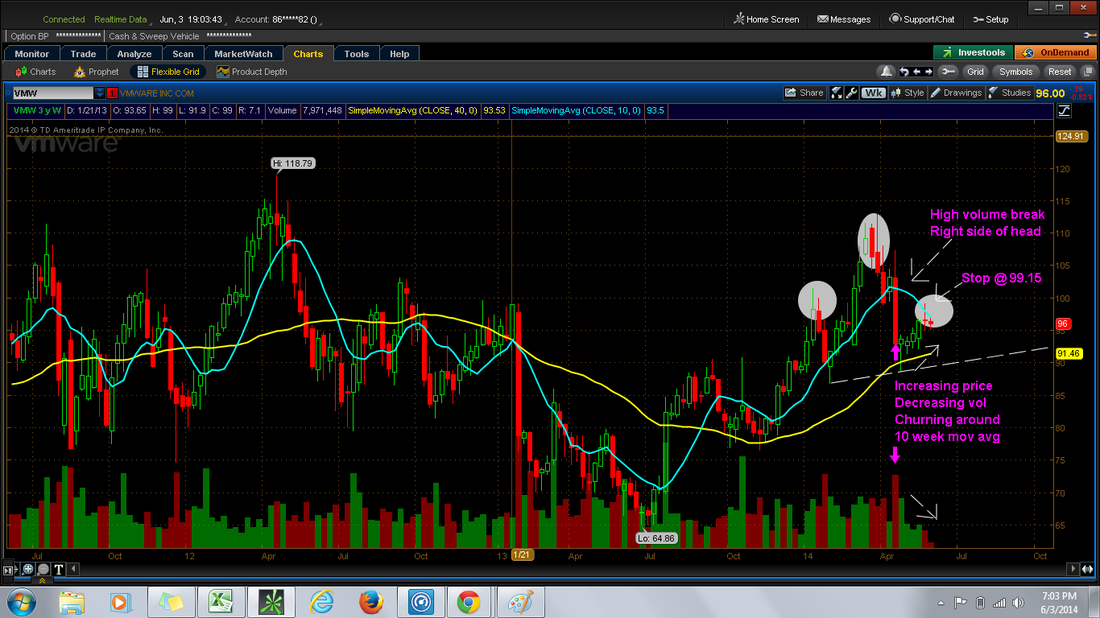
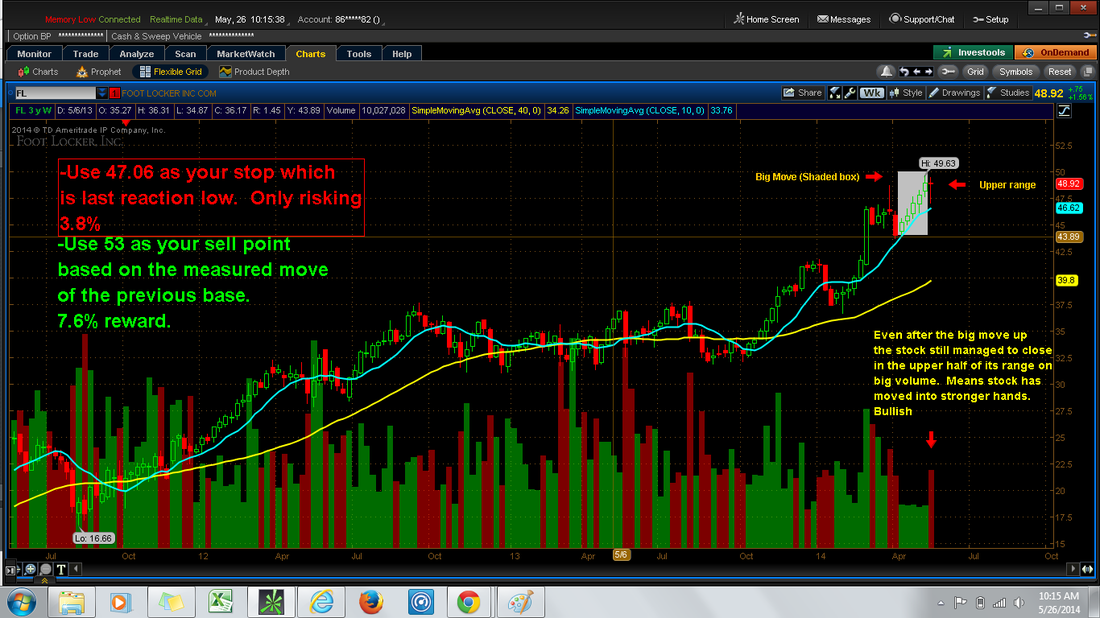
Since I got previous support at that specific price level I'm going to assume that I will get support again. Now if I don't get that support then I'm going to bail on the trade and cut my losses. Remember, its ok to take a loss. You are going to take a loss in trading. It is inevitable. Everybody does it! Your job as a trader is too limit your losses when you do turn out to be wrong. The best thing to do, in my opinion, is take advantage of having a stop on each position I put on. Here's an example of a position I currently have on.
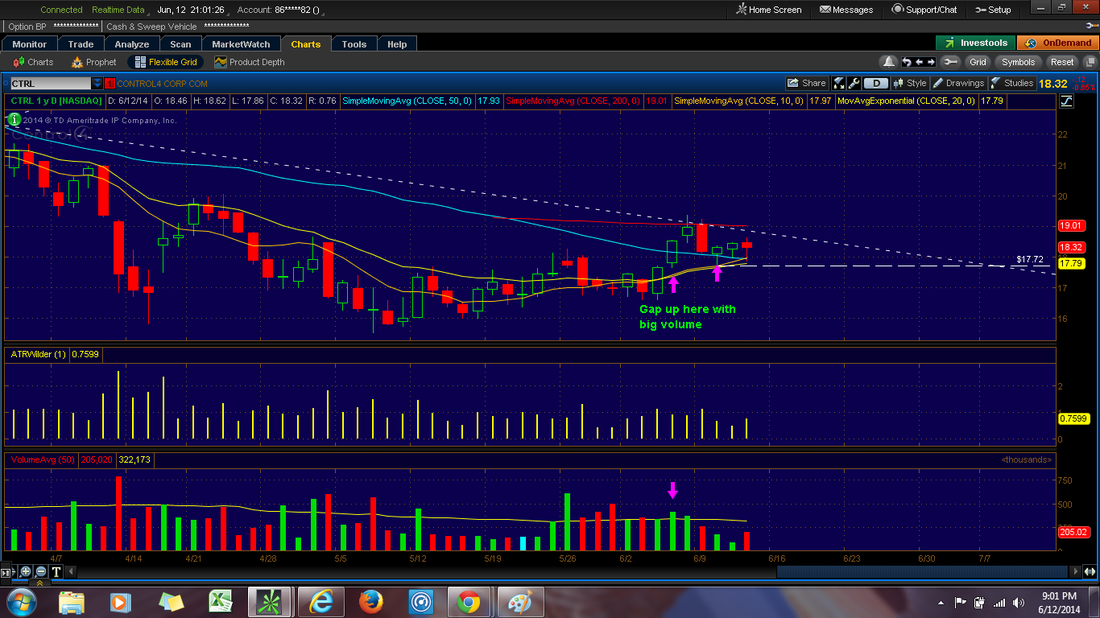
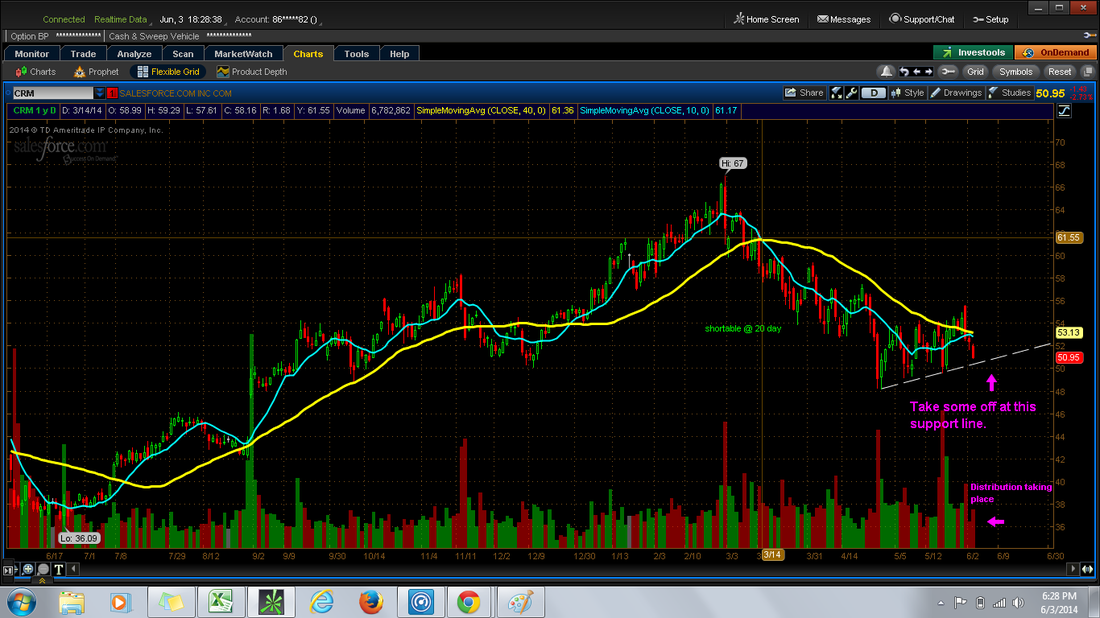
What i'm trying to highlight here is the logical area of support, if broken, totally invalidates the trade that I put on. In this case, CTRL, had a nice gap up day with volume just last week. This is an important day as buyers took control and pushed the stock out of a range it had been stuck in for quite sometime (between 16 and 18). My thesis is: if this stock is so strong, and if that day is for real, then this stock should not undercut that low that was put in just two days ago (the second arrow on the chart). This stock should not return to its range if I am right. Because of that I put my stop @ 17.71 which is a penny below the most recent swing low. And since the cost basis on my position is 18.32 then my total risk is .61 cents/share or 3.3%. My price target for the position is 20 which makes the reward 8.4%. Definitely a worthy candidate. Now its up to you to determine how much you are willing to risk on that position. It all comes down to portfolio and money management and that is just as important as trading itself.
So in conclusion, don't get scared off by the news headlines. Listen to what you're stock is saying. Listen to what the chart is saying. All you have to do is listen. Easier said then done.
Til next time,
Timmy!
So in conclusion, don't get scared off by the news headlines. Listen to what you're stock is saying. Listen to what the chart is saying. All you have to do is listen. Easier said then done.
Til next time,
Timmy!
 RSS Feed